Create a health data spreadsheet
To use staty for analyzing your health, you need at least one spreadsheet with health data.
Create a spreadsheet in Google Drive
- At best, use a computer or tablet, not a small screen.
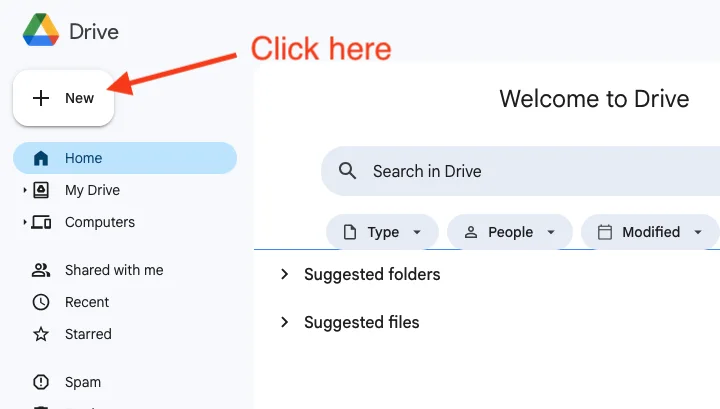
Go to drive.google.com and click "New":
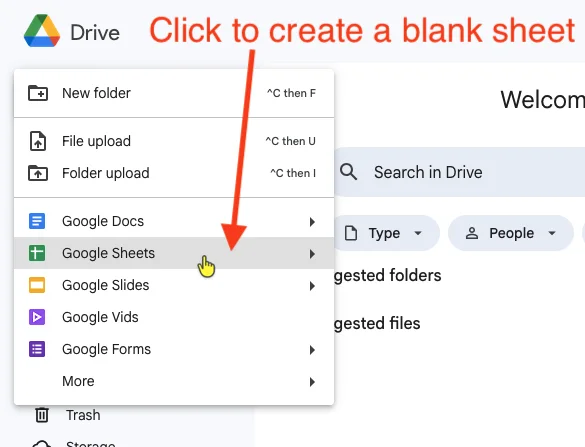
Click "Google Sheets" to create a blank spreadsheet:
Fill in some data in the following format. We'll get to the exact format requirements a bit later.
Category 2025-11-26 2025-11-27 2025-11-28 2025-11-29 2025-11-30 2025-12-01 Headache strength (0-3) 0 3 1 2 0 0 Sleep problems (0-3) 3 2 0 0 1 1 Magnesium dose 0 500 500 0 500 0 Aspirin dose 1x morning, 1x afternoon 1x morning 0 0 Breakfast time 08:34 11:30 06:30 08:09 10:02 I fasted Now it could look like this in the Google Spreadsheet web application:
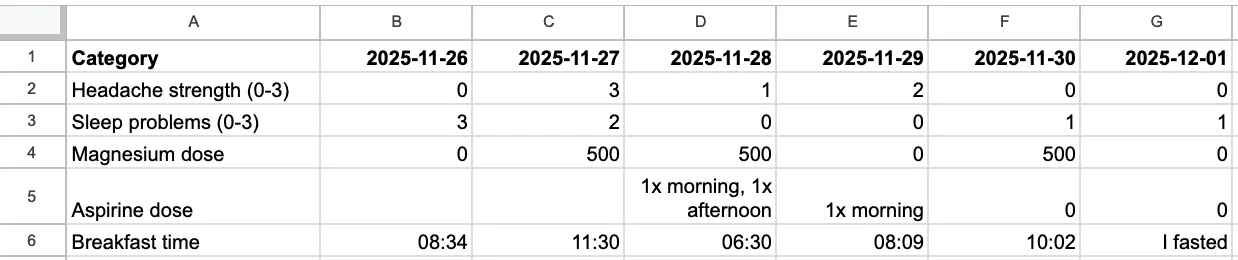
That's it. The spreadsheet should be saved automatically whenever you edit something, as long as you're online. You're ready to add this spreadsheet to staty. This only needs to be done once.
Add the spreadsheet to staty
- Open the staty app at app.staty.org
At the top-right corner, ensure you're logged in with the same Google account that owns the spreadsheet you just created. 8. Click "Spreadsheets" and "Choose an existing spreadsheet in your Google Drive"
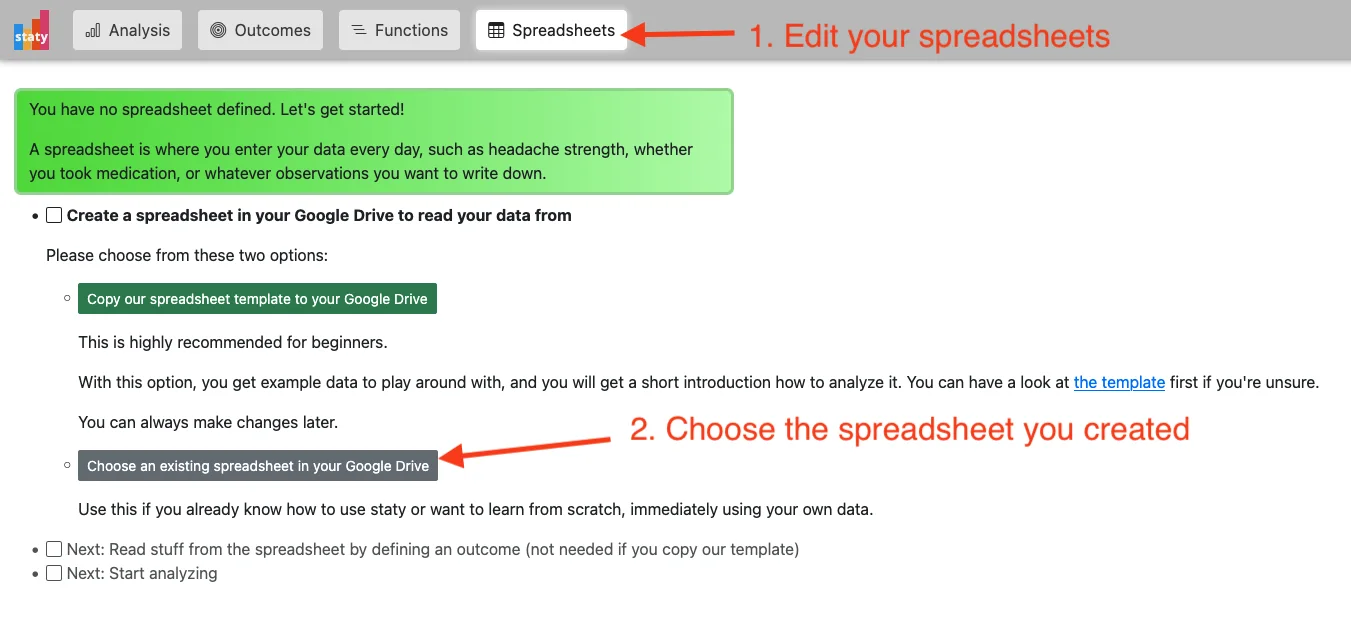
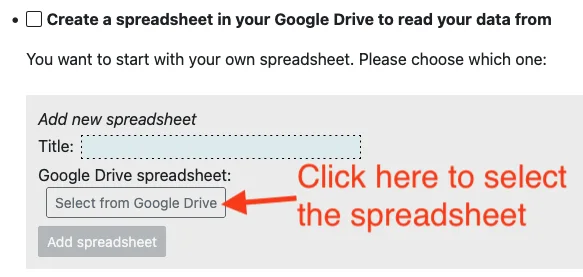
Click "Select from Google Drive"
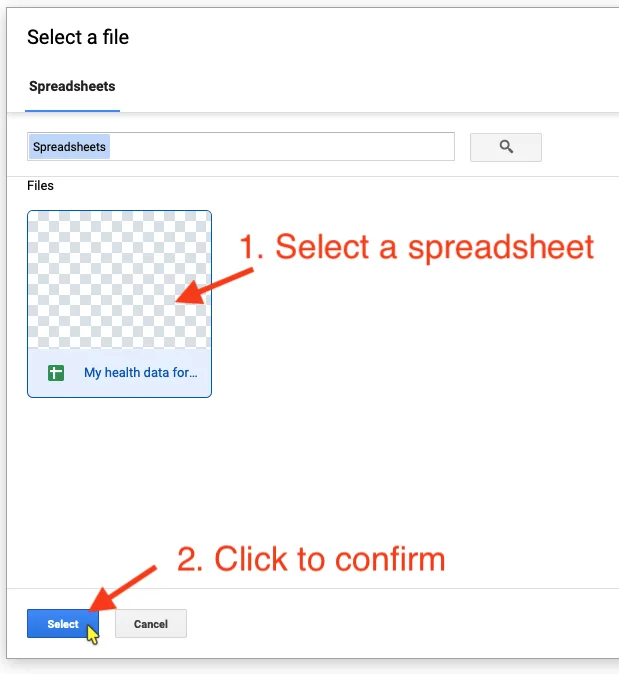
Select one of the spreadsheets in the Google Drive dialog and click "Select" to confirm
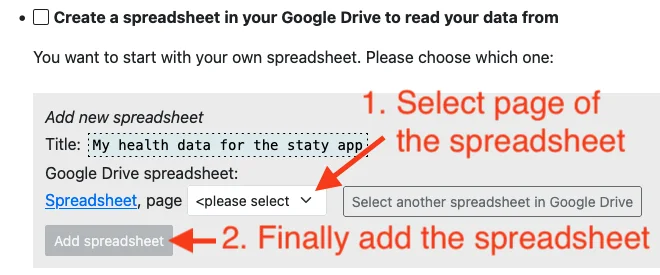
Select one page of the spreadsheet (the first one is normally called "Sheet1" if you didn't rename it). Then click "Add spreadsheet" and you're ready to use it in staty!
Format requirements
- The first column contains your descriptions, for example "Headache strength".
- The first row contains the date for which you enter data. It only allows international format
YYYY-MM-DD(year, month, day). Days may be missing in between, but it's recommended that you write down stuff every day if you want meaningful results. - The top-left cell (A1) is not used.
- The other cells, into which you fill values such as headache strength, are free-form. You can enter any value. Numbers are easiest to analyze, but staty is very flexible.
Examples for values:- Numbers: headache strength as score between 0 and 3, where 0=no headache, 1=light 2=quite some pain 3=day is ruined and I just want to lie in bed. Example:
3. See our supported standard formats for use of scores. - Time of day: time of first meal of the day. 24-hour HH:MM (hour, minute) format is recommended since it is fully supported. Example:
23:15(that's 45 minutes before midnight). This is a supported standard format. - Text: brand, name or dosage of some medication or supplement, for example
Aspirin 500 mg. - Mix of the above: Example:
20:12, Aspirin 500 mg, 23:30, Aspirin 500 mg. This says that you've taken two pills on that day, together with the dose and time. The value could be split into different outcomes, such as "Which brand did I use on that day?", "Which total dosage did I use on that day?", "When did I take the first pill on that day?", etc. Writing down product intake (medication, supplements, etc.), as in this aspirin example, as standard format. - Anything you can imagine, as long as you manage configuring staty to read it. More examples will be provided in the other guides.
- Numbers: headache strength as score between 0 and 3, where 0=no headache, 1=light 2=quite some pain 3=day is ruined and I just want to lie in bed. Example:
Try out the spreadsheet
To check if your spreadsheet works, you need to create an outcome that reads from it. Very often, an "outcome" is exactly what you entered in one of the spreadsheet rows: for example, if you enter "Headache on a score 0-3", you'll probably create an outcome "Headache" that uses exactly that entered score number without any changes. Here's how to do it in this simple case:
In the top navigation bar, click on "Outcomes":

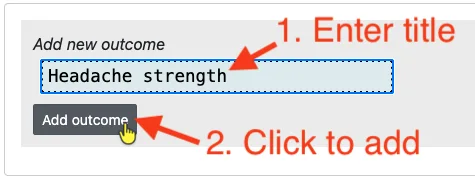
Create a new outcome, for example titled "Headache strength":
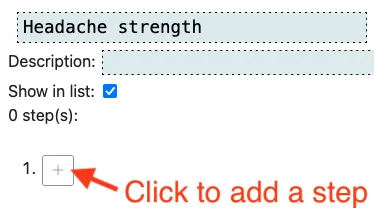
Open the new outcome for editing, then add a step:
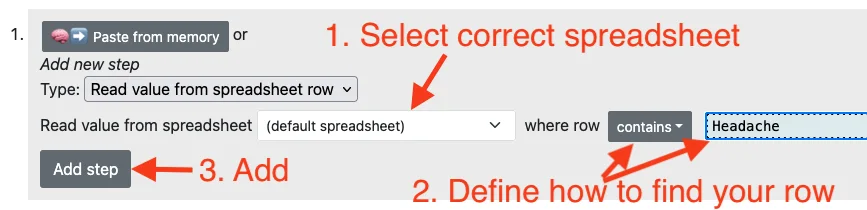
Configure the step to read the headache row from your spreadsheet. Note that if you don't specify which spreadsheet to read from, and you have more than one, the step reads from the default spreadsheet (set it on the "Spreadsheets" tab). So if you have more than one spreadsheet, you may want to select the correct spreadsheet here.
In this example, you write down a headache score between 0 and 3. So when you analyze your data later, you want the Y axis of graphs to go from 0 to 3 as well. Change the default value of 10 to 3:

Fill in data every day
Don't skip entering data on any day – gaps make the data useless. The name "staty" comes from "statistics" but also sounds like "steady", and you need both. If you really forgot on one day, leave the cell empty, instead of guessing and filling in a probably wrong value – "did I take that pill yesterday or not?".
If you don't always have the time to edit your spreadsheet, as a quicker alternative, you can take a picture or screenshot of what you want to write down, for example medication or supplement intake, or a food or drink that you're having. It just takes a few seconds and automatically includes the day and time. You can then fill it into the spreadsheet later and delete the pictures from your phone.
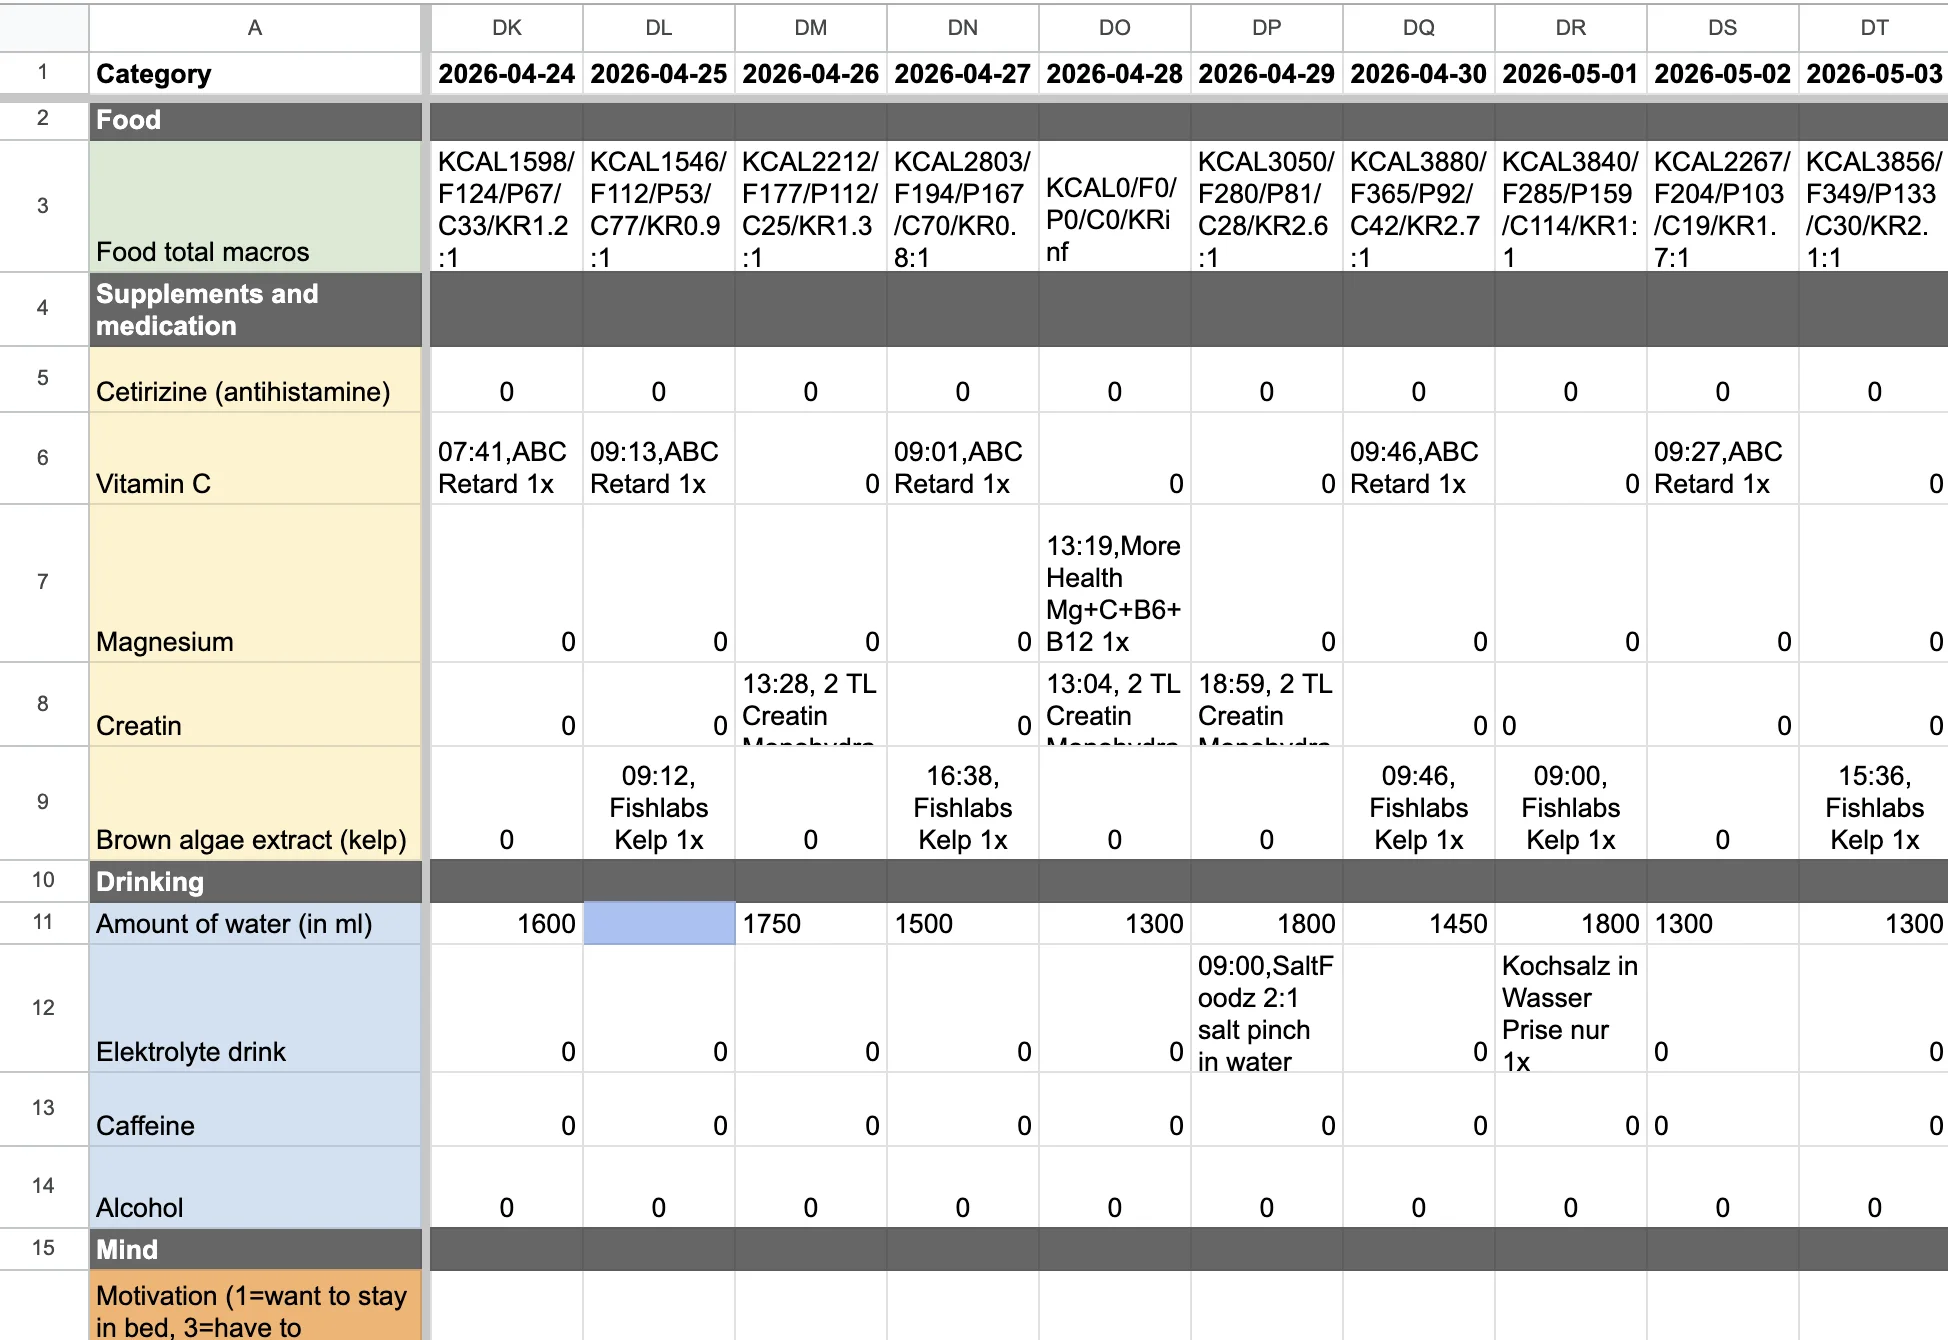
Below is an almost fully-filled example. Conditional formatting highlights empty cells in blue so they are easy to spot.
Basic usage, writing down and analyzing your own data
How to add more day columns
After a few days, your sheet is full. Right-click on the right-most column and select
Insert 1 column right. Then fill in the date by selecting the last-filled date and dragging it to the new column. That should fill the next date correctly. Remember to use the international formatYYYY-MM-DD.Remove extra rows
By default, a sheet has 1000 rows. When editing, this can be annoying because of the large, unused and empty area that you can scroll to. On a large screen (not in the app), find the first unused row and click on its number on the left (for example
14). That will select the entire row. Then scroll all the way down to the last row (for example1000). Press theShiftkey and click its number on the left. Now you should have the unused rows selected. Right-click on the numbers on the left side and clickDelete rows ….Write down and analyze data
Above, you already saw the format of the sheet: on the left are the names of outcomes (or categories, call them how you want) that you want to analyze, and each row is filled with your data for one outcome, day by day. The best and easiest choice is to use our standard formats.
If standard formats don't cover your use case, you can still write down your data in any format you like, as long as a computer can reasonably read it – since you need to provide the steps to get from the raw value in your sheet to a value (often a number) that can be analyzed. For example, you have already written down your food macros (such as total calories, fat, protein, carbohydrates, salt; in kcal/grams units) in your own format
KCAL706/F48.8/P49.2/C20.6/SALT2.1and want to read that data. That's possible with staty because each of the values is clearly separated by/and it's very easy to extract the separate numbers. To solve such a "text extraction" task, software developers love regular expressions and they're in fact easy to apply here, in just one step: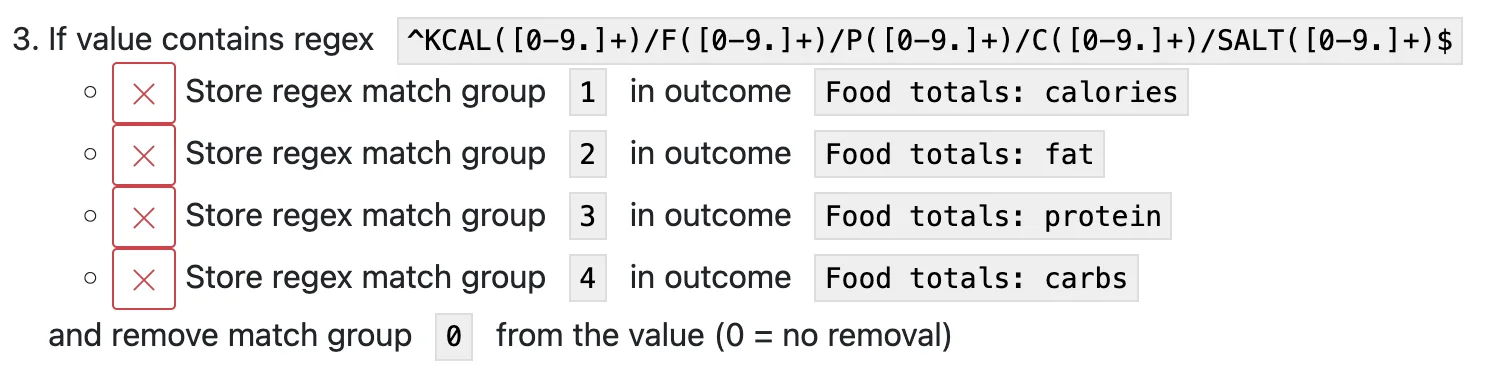
You can see that staty is very flexible. But there still aren't many guides and videos, so please give us feedback on which explanations you need.
But maybe your data was written down in a very human, journal-style way, such as
Today I felt weird, nauseous and got a strong headache at 5 PM? That's not computer-readable, so consider adding a new row to your sheet, switching to one of our standard formats. They still allow human comments, so it could look like this:17:00, 3 (nauseous, weird feeling). This structured format says that your headache started at 5 PM, was very strong (e.g. 3 on a scoring range of 0-3), and you still have the comment in there which isn't used for data analysis and graphs. You might even want to add a second row for nausea, also using a score 0-3 (e.g. 1 = slightly nauseous, 2 = feeling pretty bad, 3 = vomited), especially if you regularly have this symptom and want to get rid of it. That would mean the human comment isn't even needed and you only write down structured data that can be analyzed.
Recommendations: make your spreadsheet even better
If you only start using staty, better stop here. First find out if writing down stuff into a spreadsheet and analyzing the data is for you. If you do it for a long time and want something better, you'll notice that all the scrolling and data entering can be cumbersome. Unfortunately, if you copied our official template, these improvements wouldn't be copied. So here are some easy improvements for your editing experience that you can apply yourself:
Fix first column and row
When scrolling right or down, the date and outcomes disappear. Keep them fixed as follows: Select the first row by clicking on the "1". Then in the menu, click
View > Freeze > 1 row. Same for the first column: click on the first column "A", thenView > Freeze > 1 column.Edit on large screen
Google spreadsheets are used in staty because, among other reasons, the mobile app is as great as the website. However, the more data you collect daily, the easier it becomes if you quickly fill in your spreadsheet using a real keyboard, mouse and big screen. It's much less hassle and time. Please provide feedback if you think it's still annoying to edit your sheet this way – we are working on prototypes that make entering data easier and want to know if people would like that.
Make columns so narrow that editing in the mobile app isn't a pain
You don't write an essay into each table cell, do you? Therefore, think of selecting all columns, or all except the first one ("A"), by clicking on the first column to select, holding the Shift key, and then clicking the last column to select. Right-click and choose
Resize columns [...]. A width of 75 seems to work to just fit dates like2025-12-08in the top row.Zoom in or out
In the Google Spreadsheets mobile app, you can zoom freely to make editing or viewing easier. When on a big screen at the computer or tablet, the web application zoom levels like 75%, 100% or 125% may sometimes work better for your eyes.
Hide old day columns once your table grows large (easy to make visible again)
Latest after a few months of collecting data, your table is so large that editing might become slower (very noticeable in the mobile app) or you lose overview. You can hide old data without losing it: select old columns, right-click and choose
Hide columns [...]. The same works for rows, which makes sense if you stopped writing down a category. To bring them back, just click the arrows that appeared.