Learn health data analysis with the example spreadsheet
When you sign up for staty, you can choose to start with a ready-made example spreadsheet and a short introduction that walks you through your first analysis. It's not easy to understand everything at once, so this guide covers that same example in steps that you can easily follow at your own pace.
You'll see what the example spreadsheet contains, learn the handful of terms we use (such as what an "outcome" is), and then try three small analyses that compare the example symptom (headache strength) against the example interventions (two supplements). No prior experience with health tracking or statistics is required: if you can read a table, you can follow along. Mind that the example spreadsheet is fully contrived – we do not claim that magnesium or vitamin D would help headache for anyone or everyone, and if you want to find out if these or other treatments help you, you can follow this guide to find out.
What you'll learn
- How the example spreadsheet is laid out
- Which symptoms and interventions it tracks
- The few terms you need: spreadsheet, outcome, analysis, condition, combination
- Four analysis examples you can reproduce click by click
The example spreadsheet
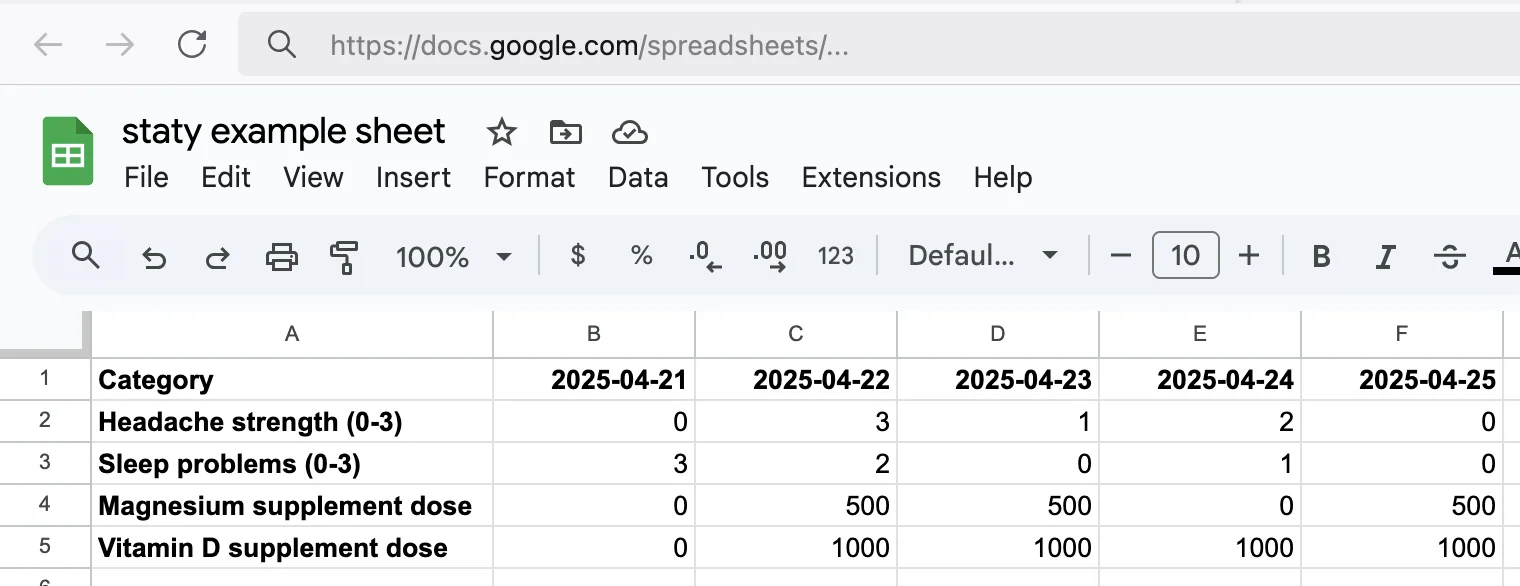
If you decided to copy the above example spreadsheet to your Google Drive, you're ready to start. Otherwise, you can still get it under Spreadsheets. It's a copy, so it's yours to keep and you can make any changes you want.
Above, you see that the starting date, the first day on which something was entered, is 2025-04-21, or 21st of April in year 2025. staty only supports this international date format YYYY-MM-DD to avoid confusion, for example when sharing data or screenshots with others. It also sorts nicely. See Create a health data spreadsheet where the required format is explained.
Typically, you use a single spreadsheet that holds all of your health data. A second spreadsheet, or a second page on your spreadsheet, probably makes sense if you have take care of data for another person, such as your kid. You always fill one column per day.
The example spreadsheet intentionally contains only a few date columns and rows so it stays easy to understand.
Symptoms and interventions in the example
- Symptoms (what you'd like to improve): Headache strength on a score of
0-3, and Sleep problems on a score of0-3 - Interventions (what you try in order to feel better; you could also call these experiments or treatments): Magnesium supplement dose in milligrams, and Vitamin D supplement dose in IU (international units)
- Magnesium is written down as product and amount, for example
SuperExampleMagnesium 400 mg,AlternativeExampleMag 200 mgorMagMix 6-in-1 300 mg. staty extracts the product and dosage amount for you. - Vitamin D cells hold a plain number of IU, for example
2000 - Empty table cells mean you didn't write anything down on that day, for example if you simply forgot. When not taking vitamin D on a day, you should clearly write down
0.
Terminology you should know
- Spreadsheet: the table with your raw daily data. Most users have exactly one. Only Google Drive spreadsheets are supported. You can have multiple pages in one spreadsheet document, but usually having just one makes most sense.
- Outcome: one thing you want to analyze. An outcome can be a symptom, an observation, a supplement or medication intake, an intervention, an activity, or else.
- Analysis type: how values are grouped, for example the average over all time (the default) or average by year and month
- Date range: the start and end date to look at, such as the last few weeks; leaving it empty means all time
- Condition: the "if" part of a question, for example "What was my headache strength on days where I took at least 200 mg magnesium?"
- Combination: a simpler way to compare one outcome across several values of another, for example "What was my headache strength at 0 vs. 1000 vs. 2000 IU of vitamin D?".
A combination simply creates a condition for each value (0 vs. 1000 vs. 2000), so conditions and combinations are essentially the same concept.
How to analyze: four examples
Each example uses the Analysis form on the main page when you log into the staty app. Fill in the fields in order, then click Analyze!.
Example 1 – Headache over time
- Question: how did my headache change over the months?
- Outcome: Headache
- Analysis type: average by year and month, so each month gets its own value
- Date range: leave empty for all time, or narrow it to a period you're curious about
- Read the bars: a rising or falling trend across the months shows how your headache developed, though it doesn't say why
Example 2 – Headache vs. vitamin D
- Question: does my headache differ on days with more or less vitamin D?
- Outcome: Headache
- Combine with: Vitamin D supplement dose, grouped into a few doses such as 0 / 1000 / 2000 IU
- Date range: leave empty for all time, or narrow it to a period you're curious about
- Read the bars: a clearly lower headache bar at higher doses hints at a helpful effect, but it is not yet proof
Example 3 – Headache vs. magnesium
- Question: does magnesium make a difference for my headache?
- Outcome: Headache
- Combine with: Magnesium supplement dose, grouped into doses such as 0 / 200 / 400 mg
- Everything else stays as in example 2
- Compare the bars the same way, one bar per magnesium dose
Example 4 – Headache vs. vitamin D, with and without magnesium
- Question: does vitamin D help my headache differently depending on whether I also took magnesium?
- Outcome: Headache
- Combine with: Vitamin D supplement dose, grouped into a few doses as before
- Condition sets: add one set "with magnesium" (Magnesium supplement dose is at least 200 mg on the same day) and one set "without magnesium" (magnesium is 0)
- Now each vitamin D dose is shown once with magnesium and once without, so you can spot whether the two work together
- This is the most advanced example; you don't need it every time, and it's fine to stop after the earlier examples
Reading the results
- Fewer days behind a bar means less certainty, so treat small groups with caution
- A difference between bars is a hint to investigate, never proof that one thing caused the other
- No chart but also no error usually means there's no data in the chosen date range; widen it or check the spreadsheet
- To learn why correlation isn't causation and how to test an idea properly, read Learn health science for yourself
Next steps
- Replace the example rows with your own symptoms and interventions once you're comfortable
- Enter data every single day, since gaps make the analysis unreliable
- Use our standard formats so you don't have to configure anything by hand
- Tell us which examples or explanations you'd like to see next: feedback form
- Add more columns (dates) and rows (outcomes)